

Startup Data - Ecosystem and Platform, Sectors, Marketplace, Fundraising/Funded, Commit data, Investor Data
2017 in Review provides an update on the ups and downs in the startup ecosystem for the year. Additionally, we also present the trends, we observed on our platform, defined by investor activity and funding patterns.
The LetsVenture team analyzed the startups that raised the angel round (disclosed), for the year 2017.
Startups analyzed: 298 (Ecosystem data)
Avg Funding: $ 629,426 (Ecosystem data)
Supply Side Analysis (Deals that went through)

In total the year of 2017 saw 298 deals, with 109.53 Million dollars investment. Separately
- Q1 saw 94 deals, 31.8 M USD being invested
- Q2 saw 83 deals, 30.6 M USD invested
- Q3 saw 66 deals, 24.9 M USD invested
- Q4 saw 55 deals, 22.5 M USD invested
The number of deals that went through, as well as the funding received, has declined over the year. From Q1 to Q4, funding declined by 29.56%; the number of deals declined by 41.48%. The decline of the number of deals is a clear indication of investors rising interest for startups that have significant traction and experienced founding team. Investors are now seriously looking at Startup Angel Investments as an asset class. And are prohibiting themselves from blindly putting in money, which is quite healthy for the startup ecosystem.

Average deal value for the year 2017, was $629,496
- Average for Q1, $557,877
- Average for Q2, $695,591
- Average for Q3, $672,243
- Average for Q4, $618,173
The average value of deal size peaked in Q2. Average value of the deal for Q4 was same as the yearly average. A decline in average deal size over the quarters from Q2 to Q4 indicates that investors are getting much more cautious in spending their hard earned money.

Keeping into account, the average deal size variation. While the average deal size peaked in Q2, the media cheque size was lower. And while the Q3 average deal size was lower than that of Q2, the median cheque size is steepest.
Average deal size and median deal size for Q4 remained close to yearly average. Which indicates a sobering effect in action. And is a true reflection of the startup ecosystem’s progress to maturity.

Overall, Bangalore saw the highest funding over the year, with 34.9 Million dollars in investment. Followed by Delhi/NCR (31.5 Million dollars) and Mumbai (19.8 Million dollars).
Whereas the number of deals was maximum for Delhi/NCR (96), followed by Bangalore (91) and Mumbai (56).
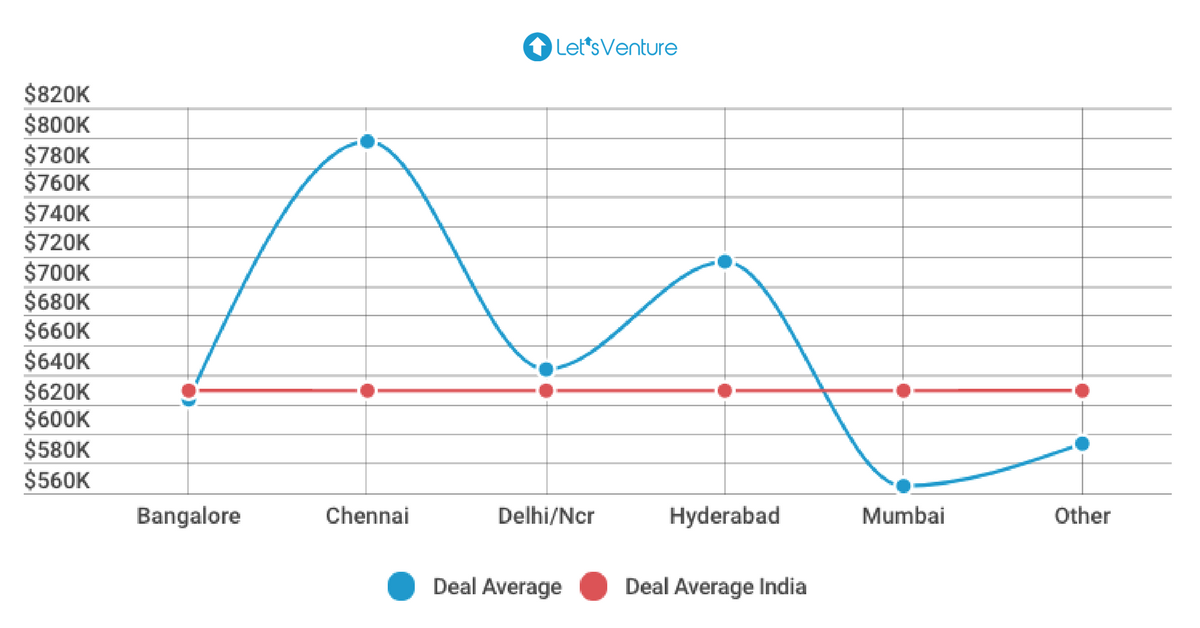
Moving on to the city wise average deal size. Bangalore (623,500 dollars) and Delhi (643,633 dollars) almost coincided with (629,496 dollars) national average. Whereas Chennai, Hyderabad and Mumbai remained the outliers.

Median deal size for Bangalore, Hyderabad, and Mumbai coincide exactly with the national average of 500,000 dollars showing strong harmony with the overall startup ecosystem. Chennai again remained the outlier owing to fewer deals and bigger cheques sizes. Interestingly, though Delhi’s average deal size strongly correlated with the national average there’s a significant deviation from the median deal size which remained at 570,000 dollars.

Overall, 282 deals out of 298 happened in T1 city, 10 in T2 and 6 in T3. The quarter wise distribution is as follows:
- Q1 saw 88 deals in T1, 2 in T2, 4 in T3
- Q2 saw 80 deals in T1, 2 in T2, 1 in T3
- Q1 saw 63 deals in T1, 3 in T2, 0 in T3
- Q1 saw 51 deals in T1, 3 in T2, 1 in T3
This trend is clear indication that T1 cities are highly favorable for startups as far as funding is concerned with 94.63% of the funding happening there. Though we might see a change in this trend, with the uprising of startups building impact product for India 2 (T2, T3 cities).

Let’s now analyze the sector distribution of the startups that got funded in 2017
(Only the top 5 sectors, of the entire year, have been analyzed)
- Healthcare, Enterprise Software and FinTech held the top 3 positions overall. Followed by Education, Retail, Food & Beverages. Whereas Logistics, Automotive and Information/Tech remained the lowest funded sector
- Surprisingly AI followed Food & Beverages and stood 5 in the total funding received metric and surpassed Fashion vertical.

This is how the number of fundings for the top 5 funded verticals looked like over the quarters.
(Comparison, for the top 5 sectors over the year only)
- Healthcare topped the chart in Q1, followed by Enterprise Software, FinTech, Education and Retail
- Continuing the trend, Healthcare again topped the charts for Q2, but this time FinTech overtook Enterprise Software breaking the trend of the previous quarter. Education stood at third position, followed by Enterprise Software and Retail
- In Q3, Enterprise Software caught up with healthcare to share the first position followed by FinTech, Retail sharing the second position and Retail third
- Q4 saw Enterprise Software as the clear winner. Education surprisingly jumped to the second position, followed by FinTech. Last position shared by Healthcare and Retail.
- Even though Healthcare, in general, saw the steepest decline in the number of fundings since Q1. Healthcare topped the charts for overall deals in 2017, followed by Enterprise Software, FinTech, Education and Retail
Demand and Supply Comparative Analysis (Ecosystem)
Distribution in the percentage of the companies, that raised funds and were looking to raise funds in the year 2017.

Next, we compare the percentage of companies on the fundraising and funded side for the year 2017. Blue bars show the percentage of companies raising funds while the red line shows the percentage of companies funded in each sector. Here is what we think:
- Enterprise Software, Education, Internet of Things, Transportation, Information/Tech, Logistics were fairly balanced overall
- Healthcare, FinTech, Real Estate, Analytics, Big Data saw an imbalance in demand and supply. With more supply than demand
- Retail, Food & Beverages, AI, Fashion, Media & Entertainment, Travel & Tourism, Services and Automotive saw more demand than supply. Surprisingly AI, which has a rather slow in Q1, caught up fairly well. And now had more demand than supply
Quarter over Quarter at glance (Most funded and least funded sectors)

Q1 (Jan-Mar 2017)
Most funded: Enterprise Software, Healthcare, Education

Q2 (Apr-Jun 2017)
Most funded: Healthcare, FinTech, Food & Beverages
Q3 (Jul-Sep 2017)
Most funded: Enterprise Software, Healthcare, FinTech

Q 4 (Oct-Dec 2017)
Most Funded: Enterprise Software, Education, FinTech
Market Type Of Startups (In percentage for the year 2017)

- Around 62.1 percent of the companies that got funded this year were B2C and 37.9 Percent were B2B
- Around 43.4 percent of the companies, raising funds were B2B, whereas 56.6% were B2C
Location distribution (In percentage for the year 2017)

- 82.28 percent of the deals have happened in Tier-1 cities. While 15.74% of the fundraising happened in Tier-2 cities and 1.96 percent in Tier-3 cities. We see this trend changing with the rise of startups building for India 2
Our startup team analyzed 3000+ investors and their platform activity for the year 2017.
Our progress in 2017, so far:
No. of experienced angels onboarded - 458
No. of new angels onboard - 1105
No. of experienced angels who joined - 336
No. of new angels who joined - 699
Sectors Preferred by the Investors this year

Consumer Goods, Healthcare, FinTech
- Healthcare, FinTech were the second and third highest funded sectors on the platform which is in synergy with the yearly ecosystem trends. Surprisingly Consumer Goods, holds the first position on the platform as far as funding is concerned, whereas it’s amongst the least funded sectors as far as ecosystem data is concerned. Gaming, Event were the least funded sectors which again is in synergy with the ecosystem data
Commits on LV

Investors Demographics
City Wise data for Investors onboard in 2017 (T - 1,2,3, Foreign)

*Please note that the report covers disclosed deals less than $1.5 Mn only


.png)

.png)


